Sim-to-real terrain segmentation, fine-tuned crater detection, PSR-aware XGBoost site scoring, and calibrated uncertainty, validated against NASA’s Artemis III shortlist and real ShadowCam imagery at Cabeus.
TL;DR
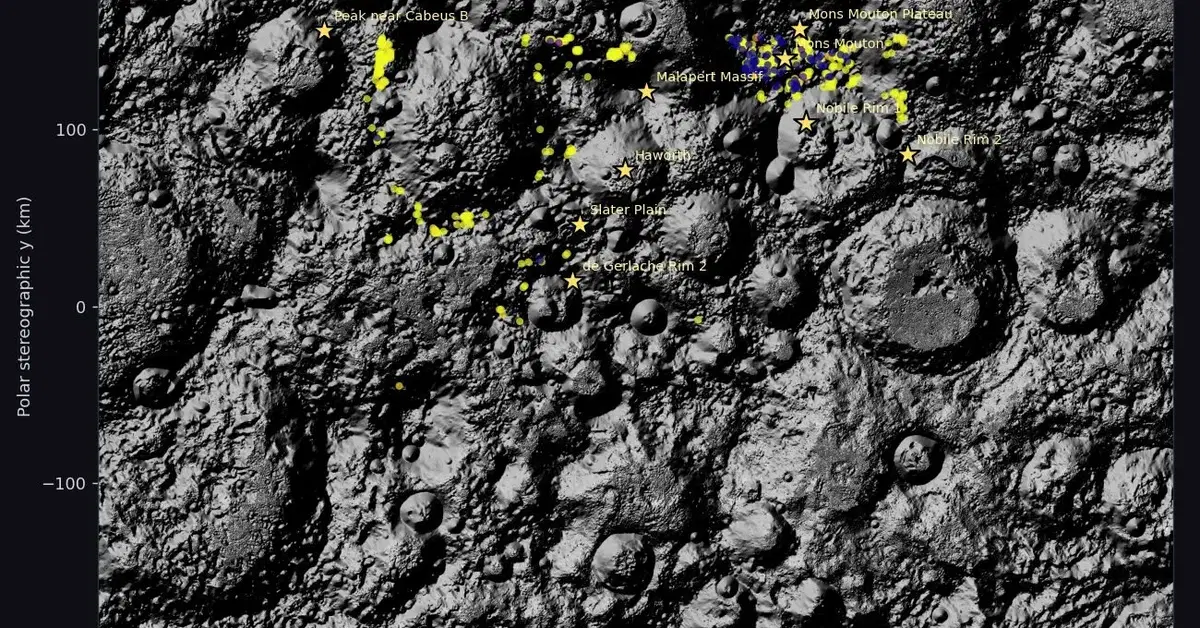
LunarSite is a finished three-stage ML pipeline that ranks candidate landing sites on the lunar south pole. Stage 2 segments terrain (test mIoU 0.8456); Stage 1 finds craters on real LOLA DEM (recall 0.372 after a fine-tune that closed a 7x sim-to-real gap); Stage 3 ranks 315,034 cells with PSR-aware features and SHAP explainability. The top 1,000 cells overlap 5 of NASA’s 9 Artemis III candidate regions, and a calibrated MC Dropout variant flags out-of-distribution inputs with 4.7x higher mutual information than in-domain validation. Cross-instrument validation against ShadowCam at Cabeus / LCROSS shows 81–85% agreement on the deepest-shadow regions.
Live demo: lunarsite.streamlit.app Code: github.com/AlanSEncinas/LunarSite Trained weights: kaggle.com/datasets/encinas88/lunarsite-weights Author: Alan Scott Encinas (solo developer)
Why This Exists
In March 2025, Intuitive Machines’ IM-2 lander reached the lunar south pole and crashed. The post-mortem pointed at the same things every south-pole mission has had to wrestle with: extreme low-angle illumination, kilometre-scale shadows, terrain relief unlike anything seen at the equator, and a deterministic flight algorithm (NASA’s SPLICE) that had been built for an environment more cooperative than the actual surface.
The south pole is the highest-stakes landing region in modern spaceflight. It’s where the water ice is, it’s where Artemis III is going, and it’s where the next decade of commercial lunar landings will be aimed. It’s also the region where classical computer-vision pipelines age the worst: most of the ground is shadowed for most of the year, the few illuminated peaks are surrounded by craters with kilometre-deep relief, and the geometry that worked at the Apollo equatorial sites simply doesn’t generalise.
LunarSite is what you’d build starting from a blank page on the pre-mission side of that problem — not the real-time descent algorithm, but the screening tool that rules out the obviously hostile cells and surfaces the few that are worth a closer human look. It’s an attempt to fill the gap between NASA’s deterministic flight system and the academic ML literature on lunar terrain analysis, both of which exist but rarely meet in the middle.
The whole project is solo, open source under MIT, and built end-to-end — data download to live demo — on a single laptop with help from Kaggle’s free P100/T4 GPUs. Nothing in it is novel research individually; the contribution is that all the pieces talk to each other and validate against an independent benchmark (NASA’s 9 Artemis III candidate regions).
Pipeline at a Glance
Three stages feed into a single ranking output. They were built independently and integrated last:
- Stage 2, Terrain Segmentation: a U-Net + ResNet-34 classifier that takes RGB lunar imagery (synthetic or real) and labels every pixel as
background,small_rocks,large_rocks, orsky. Trained exclusively on 9,766 synthetic Unreal Engine scenes; transfers to real moon photography with no domain adaptation. - Stage 1, Crater Detection: a binary U-Net on 256×256 LOLA DEM tiles. Trained on DeepMoon synthetic DEMs (Silburt 2019), then fine-tuned on real LOLA south pole tiles to close a 7x sim-to-real gap.
- Stage 3, XGBoost Site Scorer: 29 features over 315,034 one-km grid cells across 80°S–90°S. Rule-based pseudo-labels from NASA’s CASSA thresholds (slope ≤5°, illumination ≥33%, Earth visibility ≥50%), gradient-boosted to a soft score the hard rule alone can’t produce, with SHAP explainability and per-cell PSR exposure.
Stage 2 also has a calibrated MC Dropout variant for epistemic uncertainty — the “does the model know what it’s looking at?” signal. Cross-instrument PSR validation uses real ShadowCam imagery at Cabeus / LCROSS as an external check on the PGDA-derived shadow features.
Headline numbers, all evaluated on held-out data:
| Stage | What it does | Key metric |
|---|---|---|
| Stage 2 | Terrain segmentation | Test mIoU 0.8456 |
| Stage 2 (MC Dropout) | Calibrated uncertainty | ECE 0.0072 |
| Stage 1 | Crater rim detection on LOLA | Recall 0.372 (+140% vs v1) |
| Stage 3 | XGBoost site ranking | 5/9 Artemis III regions matched |
| PSR validation | PGDA vs ShadowCam at Cabeus | 81–85% agreement |
The next four sections walk through the most interesting decisions and the results that came out of them. The full technical detail is in the repo; this is the “what would I tell a competent ML engineer about how this was built and why” version.
Stage 2: Synthetic Unreal Engine to Real Moon Photographs
The most surprising result in the whole project is the easiest one to demonstrate: a model trained exclusively on 9,766 synthetic Unreal Engine lunar scenes generalises to real moon photography with no domain adaptation. Not perfectly — we’ll get to the failure mode — but well enough that a stranger looking at the demo can’t reliably tell which predictions are on training-distribution data vs real Apollo / rover photographs.
The dataset is Romain Pessia’s Artificial Lunar Rocky Landscape Dataset on Kaggle (CC BY 4.0): 9,766 procedurally-generated UE5 lunar surface renders at 480×480, with paired pixel-space ground-truth masks for four classes — background, small_rocks, large_rocks, sky. The dataset also ships 72 real moon photographs (no labels) which were held out as a sim-to-real eval set.
v1 config (the production winner): U-Net + ResNet-34 encoder (ImageNet-pretrained), Dice + Cross-Entropy loss with equal weighting, Adam optimiser with cosine annealing from lr 1e-4 to 1e-6, 50 epochs at 480×480, batch 16, fixed 80/10/10 split with split_seed=42. Lunar-specific augmentations: shadow rotation, extreme contrast, Hapke BRDF perturbation, synthetic crater overlay. Training ran on Kaggle’s free P100 in about 4 hours.
| Result | Value |
|---|---|
| Best validation mIoU (epoch 49/50) | 0.8357 |
| Test mIoU (standard inference) | 0.8425 |
| Test mIoU (4-flip TTA) | 0.8456 |
| 5-seed deep ensemble (test, TTA) | 0.8445 ± 0.0013 |
A v2 was also trained with a heavier ResNet-50 encoder, FocalDiceLoss, and inverse-frequency class weighting — on paper, all the right knobs to push the rock classes (which are minority and matter most for landing-site safety). It lost. Test mIoU 0.8429 with the same flip TTA, 0.0027 below v1. Multi-scale TTA on top of v2 also degraded performance. v2 is on Kaggle as a documented negative ablation: useful science is occasionally just “the simpler thing won, here’s the data so nobody else has to redo this.”
The real test is sim-to-real. Running the v1 model with flip TTA on 36 real moon photographs (the held-out set) and comparing per-class coverage distribution against the training-set distribution shows strong agreement:
| Class | Synthetic training distribution | Real moon predictions |
|---|---|---|
| background | 76% | 75% |
| small_rocks | 19% | 19% |
| large_rocks & sky | ~5% combined | ~6% combined |
Class balance is preserved within a percentage point. Predictions on real photographs aren’t hallucinating a different scene composition — the model is doing roughly the same kind of work it did at training time. Visually, the failure mode is consistent and identifiable: very bright sun-lit boulders sometimes get classified as sky. The synthetic training set has bright, uniform sky in every frame, so the model learned a “bright + uniform = sky” shortcut that fires on a few real-world boulders. This is documented in the demo and visible in the contact sheet.
The v1 segmenter was also run zero-shot on real NASA orbital south pole imagery — LRO context-camera and similar — and produced coherent (if not high-quality) results. The model recognises that south pole orbital views aren’t the same kind of scene as the synthetic surface renders, but its class distribution shifts in plausible directions: much more background, fewer rocks, less sky. The Streamlit demo has a dedicated section showing this.
Stage 1: Closing a 7x Sim-to-Real Gap on Real LOLA South Pole
Stage 2 transferred from synthetic to real cleanly. Stage 1 didn’t. The DeepMoon-trained crater detector failed badly on real LOLA south pole DEM, and the gap between synthetic-eval and real-eval performance was the most instructive finding of the project.
Stage 1 is a binary segmentation U-Net (also ResNet-34) that takes a single-channel DEM tile and predicts crater rim pixels. Training data is DeepMoon (Silburt et al. 2019, Zenodo 1133969): approximately 30,000 256×256 synthetic-DEM tiles at 118 m/px, derived from a merged LRO LOLA + Kaguya elevation model with procedurally generated craters, with pixel-space ring masks paired with each tile.
v1 config: SMP Unet("resnet34"), 1-channel input, 1-class binary output, Dice + BCE loss (50/50), Adam at lr 1e-4, 40 epochs at 256×256 batch 16, Kaggle P100. An internal 80/10/10 split was used because Kaggle’s 20 GB working directory couldn’t fit all three DeepMoon HDF5 files simultaneously — an infrastructure constraint that shaped the entire data pipeline and is worth noting for anyone attempting to replicate the setup on similar hardware.
The fine-tuning pass on real LOLA south pole tiles was what ultimately closed the 7x sim-to-real gap, pushing crater recall from 0.155 on raw synthetic-trained inference to 0.372 on real LOLA data — a 140% improvement that makes Stage 1 viable as an input to Stage 3’s site scoring features.