
Every extra second of friction has a measurable business cost. The following ten data-backed UX facts link user experience directly to revenue, retention, and long-term growth.
In the high-stakes economy of today, the cost of a friction-heavy interface is no longer just “lost clicks,” but potentially millions in wasted engineering spend and lost business value. As a veteran UX designer who has helped build digital products since the early mobile-first era, I’ve watched business leaders shift from viewing design as a “cosmetic preference” to recognising that user experience is actually the primary engine of business survival.
A UX design role is as much about research and analytics as it is about pixels, and hard data is the only tool powerful enough to bridge the gap between design and the boardroom. Facts don’t just advocate for the user; they prove that UX is a non-negotiable requirement for a healthy bottom line. Even in the rooms where decisions are made, UX is frequently undervalued as a “visual” role. The most effective way to dismantle this myth is through data.
The following ten facts represent the current reality of the digital world. These are not just “design tips”; they are the clinical, data-backed pillars for financial growth in a saturated market. Some of these facts are also commonly used by designers as best practices.
For example, on one B2C mobile design project, stripping 1.2 seconds off the mobile load time by reducing and removing some visual assets produced an immediate 12% lift in completed transactions — proving that in UX, every tenth of a second is a direct lever for revenue.
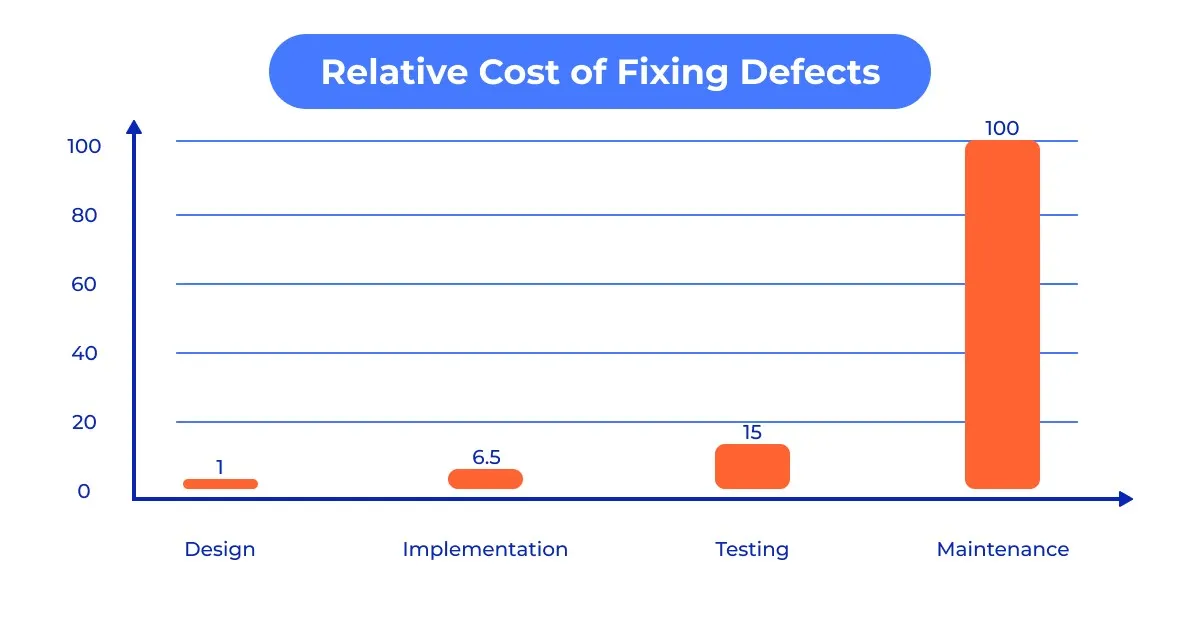
1. Fixing Issues In The Design Phase Is 100 Times Cheaper
One of the most compelling financial arguments for UX is the 1:100 rule. Modern studies, such as from the IBM Systems Institute and Segue Technologies, show that fixing an error after a product has been developed and launched can be up to 100 times more expensive than fixing it during the initial design and prototyping phase.
Think of UX as “engineering insurance.” By the time a developer touches the code, every interaction should have been validated. If you discover a fundamental navigation flaw after launch, you aren’t just paying for the fix; you’re paying for technical debt, lost developer time, and the revenue lost while users struggle with a broken flow.
2. Performance Impacts User Experience
In the current landscape, performance is the essential foundation of user experience. A beautiful interface is worthless if the user bounces before it renders. The data is uncompromising: 47% of users expect a page to load in two seconds or less, and missing this window is a financial catastrophe. A mere one-second delay can reduce conversions by 20% and satisfaction by 16%, while retail businesses lose an estimated $2.6 billion annually to slow load times. When mobile load time moves from one to three seconds, the bounce rate spikes by 32%, and by the third second, conversion rates typically plummet from 40% to 29%.
However, this volatility offers a massive lever for growth. Even a microscopic 0.1-second improvement can lift retail conversions by 8.4%, and travel site conversions by 10.1%. Improving your Largest Contentful Paint (LCP) by 31% — a benchmark 67% of websites achieved as of June 2025 — can drive a direct 8% increase in sales. Speed should be treated as a primary design element.
If the site isn’t instantaneous, the design hasn’t just failed — it effectively doesn’t exist.
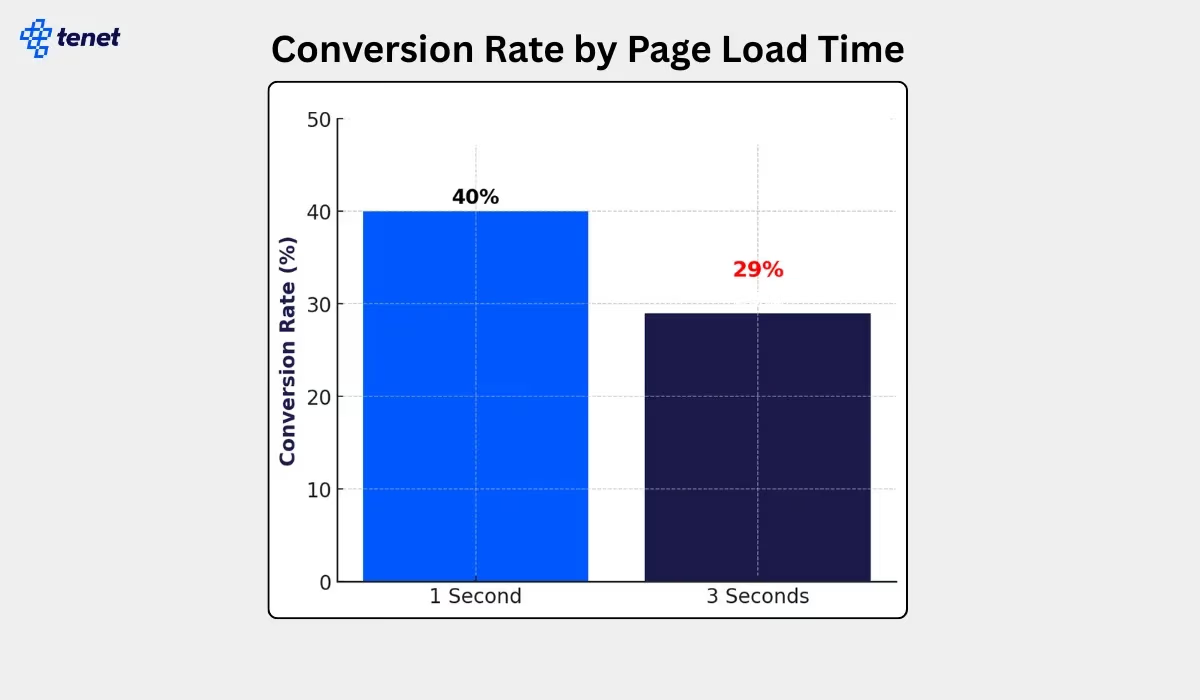
When pages load in one second, conversion rates are about 40%. (Image source: Tenet)
3. Your Site Has 50 Milliseconds to Impress Your Customers
First impressions are both visceral and aesthetic. Research indicates that users form an opinion about a website’s visual appeal in approximately 50 milliseconds (0.05 seconds). This split-second “gut feeling” is a survival mechanism that dictates whether a user stays to explore your value proposition or bounces immediately.
In the current market, 94% of first impressions are strictly design related. If your interface feels “off” or dated, users subconsciously project that lack of quality onto your entire product or service. Your content effectively doesn’t exist if your design hasn’t earned the five seconds of attention required to read it.
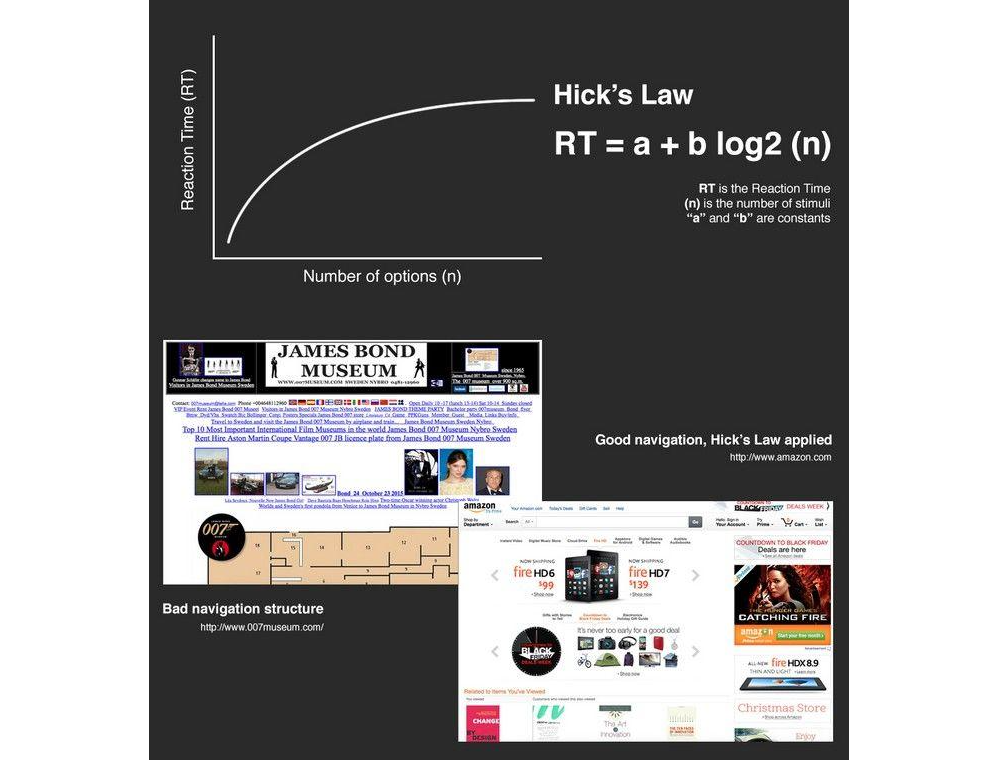
4. Hick’s Law: The Cost of Overwhelm
Stakeholders often think “more options” equals “more value.” Psychology proves the opposite. Hick’s Law states that the time it takes to make a decision increases with the number of options available.
Every extra menu item or form field is a “tax” on the user’s brain. As noted by Landbase, top-performing sites now achieve conversion rates exceeding 11%, while average performers struggle below 3%. Those performing well have applied personalization and optimization strategies to simplify the experience.
If you want to increase your revenue by tomorrow, find one field to delete from your checkout flow today.
These ten facts make the case clearly: UX is not a finishing touch applied after engineering decisions are made — it is a core business function with direct, measurable impact on revenue, retention, and competitive positioning. Treating it as such is one of the highest-leverage investments a product team can make.