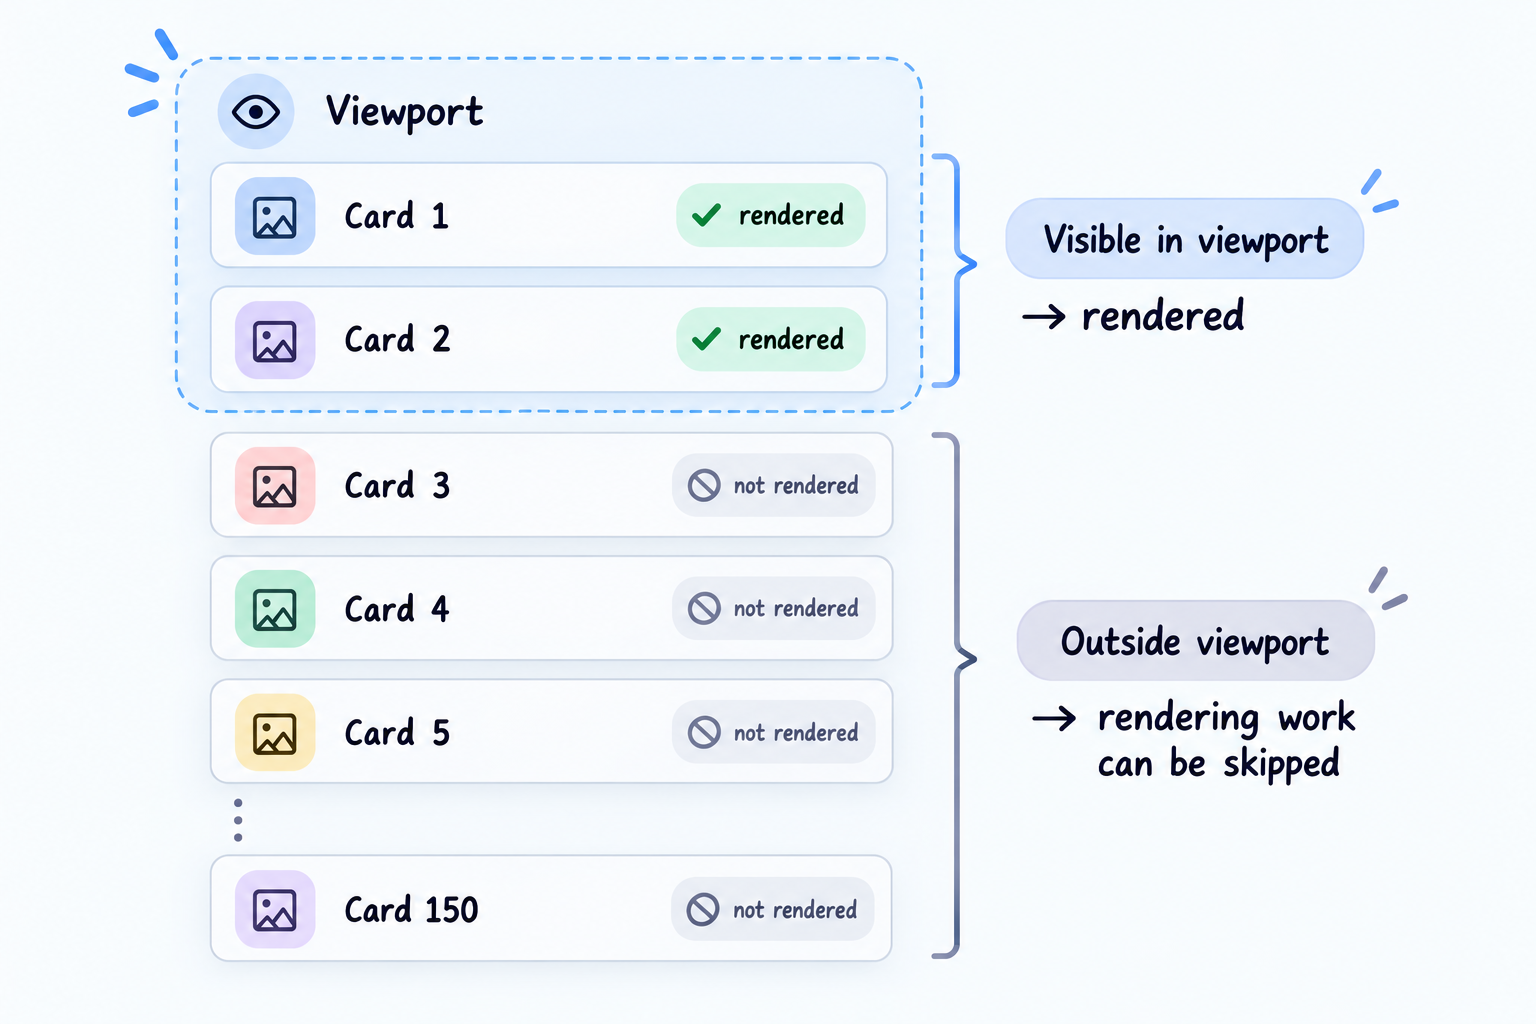
What happens when a page has 150 content-heavy cards, but the user can only see the first few?
You might expect the browser to only worry about what’s currently visible. But this isn’t exactly what happens.
Content can be thousands of pixels below the viewport, and the browser may still have rendering work to do for it.
So what if we could tell the browser:
You don’t need to render all of this right now. Skip the work for content the user can’t see yet.
CSS has a property that can help us do exactly that in one line:
.card {
  content-visibility: auto;
}
Which naturally made me curious about how much difference it could actually make.
So instead of stopping at the documentation, I built a page with 150 content-heavy cards, opened Chrome DevTools, and measured it.
The result was much bigger than I expected. But it also introduced another problem.
Let’s start with what content-visibility is actually asking the browser to do.
What We’ll Cover
- What Does
content-visibility: autoActually Do? - I Built a Page With 150 Cards
- We Saved Rendering Work. Now the Layout Has a Problem.
- Wait, Isn’t This Just Lazy Loading?
- But What About Accessibility?
- So, When Is
content-visibilityActually Worth Using?
Prerequisites
To follow along with this article, you should have:
- A basic understanding of HTML and CSS
- A modern browser such as Chrome
- Basic familiarity with Chrome DevTools
You don’t need any framework knowledge. The experiment uses plain HTML, CSS, and JavaScript so we can focus specifically on the browser’s rendering behavior.
What Does content-visibility: auto Actually Do?
The content-visibility property controls whether an element renders its contents.
For this experiment, we’re interested in one value:
.card {
  content-visibility: auto;
}
With auto, the browser can skip rendering work for an element’s contents when that element isn’t currently relevant to the user, such as when it’s far outside the viewport.
The important part is that we’re talking about rendering.
The element hasn’t been removed from the DOM. And content-visibility isn’t primarily telling the browser not to download its resources.
We’re giving the browser an opportunity to avoid rendering work that isn’t useful yet.
This works through CSS containment. As the web.dev guide explains, content-visibility: auto applies layout, style, and paint containment. When the contents aren’t relevant to the user, the browser can skip more of the work for that subtree.
So without content-visibility, the browser may still do rendering work for content far below the viewport. With it, some of that work can be skipped until the content becomes relevant.
Notice the word can.
content-visibility: auto doesn’t guarantee that every element outside the viewport will always have its rendering work skipped. The browser determines whether the contents are relevant to the user and whether their rendering can be skipped.
This sounds useful. But useful by how much?
Time to measure it.
I Built a Page With 150 Cards
I didn’t want to test this on a tiny demo where the difference might disappear into measurement noise.
So I deliberately made the page a little ridiculous. It contains 150 content-heavy cards.
Each card has:
- a fixed-size image placeholder
- a heading and tags
- eight paragraphs
- ten related items
The number 150 isn’t special.
A page doesn’t suddenly become a good candidate for content-visibility because it crosses some element-count threshold.
For example, 150 simple <div> elements may give the browser very little expensive work to skip.
But 150 sections containing nested layout, text, lists, images, and other rendering work create a much better opportunity.
For this experiment, that’s exactly what I wanted.
I also used plain HTML, CSS, and JavaScript instead of React or another framework.
That was intentional.
If we’re testing a CSS rendering optimization, adding framework execution gives us another variable we don’t need.
Here’s the JavaScript that generates the cards:
const CARD_COUNT = 150;
const PARAGRAPHS_PER_CARD = 8;
const RELATED_ITEMS_PER_CARD = 10;

const cards = [];

for (let i = 1; i <= CARD_COUNT; i++) {
  cards.push(`
    <article class="card">
      <div class="card-image-placeholder"></div>

      <h2>Product ${i}</h2>

      ${Array.from(
        { length: PARAGRAPHS_PER_CARD },
        (_, index) => `
          <p>
            Product ${i}, paragraph ${index + 1}.
            This is sample content used to make
            each card more expensive to render.
          </p>
        `
      ).join("")}

      <ul>
        ${Array.from(
          { length: RELATED_ITEMS_PER_CARD },
          (_, index) => `
            <li>Related item ${index + 1}</li>
          `
        ).join("")}
      </ul>
    </article>
  `);
}

document.querySelector("#feed").innerHTML = cards.join("");
I considered using real images, but that would make the experiment messier. Network latency, caching, and image decoding could all influence what we see.
So each card uses a CSS placeholder instead:
.card-image-placeholder {
  height: 320px;
  background: linear-gradient(
    135deg,
    #e5e7eb,
    #f3f4f6
  );
}
For each configuration, I kept the browser environment and viewport size the same, and I didn’t scroll during the initial-load recording.
I also repeated the tests instead of picking the nicest-looking run.
If you want to reproduce the experiment, the complete example is published on GitHub. It contains the same test page and configurations used for the measurements below, so you can run the experiment yourself and compare results on your own browser and device.
First, the Baseline
Before adding content-visibility, I recorded the page three times using the Chrome DevTools Performance panel.
The Rendering activity reported in the Performance recording was:
| Run | Rendering |
|---|---|
| 1 | 39 ms |
| 2 | 44 ms |
| 3 | 42 ms |
| Median | 42 ms |
I used the median rather than choosing the fastest run.
There’s one important clarification here. These numbers represent the Rendering activity reported in the DevTools Performance recording.
They’re not total page-load time, a Core Web Vital, or a direct measurement of user-perceived performance.
Chrome DevTools reports Rendering as one category in the activity breakdown of a Performance recording, which is why I’ll keep referring specifically to the Rendering activity rather than saying the page “rendered in 42 ms.”
So our baseline was:
Median Rendering activity: 42 ms
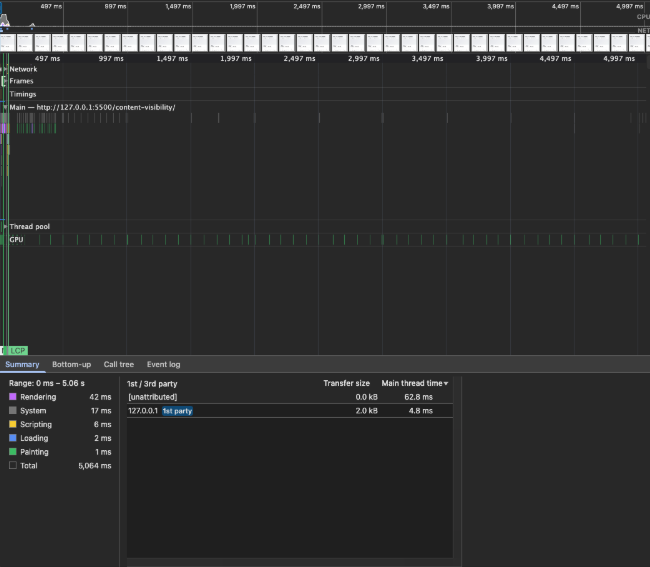
One baseline Performance recording. The 42 ms median above was calculated from three separate runs.
Then I changed exactly one thing:
.card {
  content-visibility: auto;
}
And ran the experiment again.
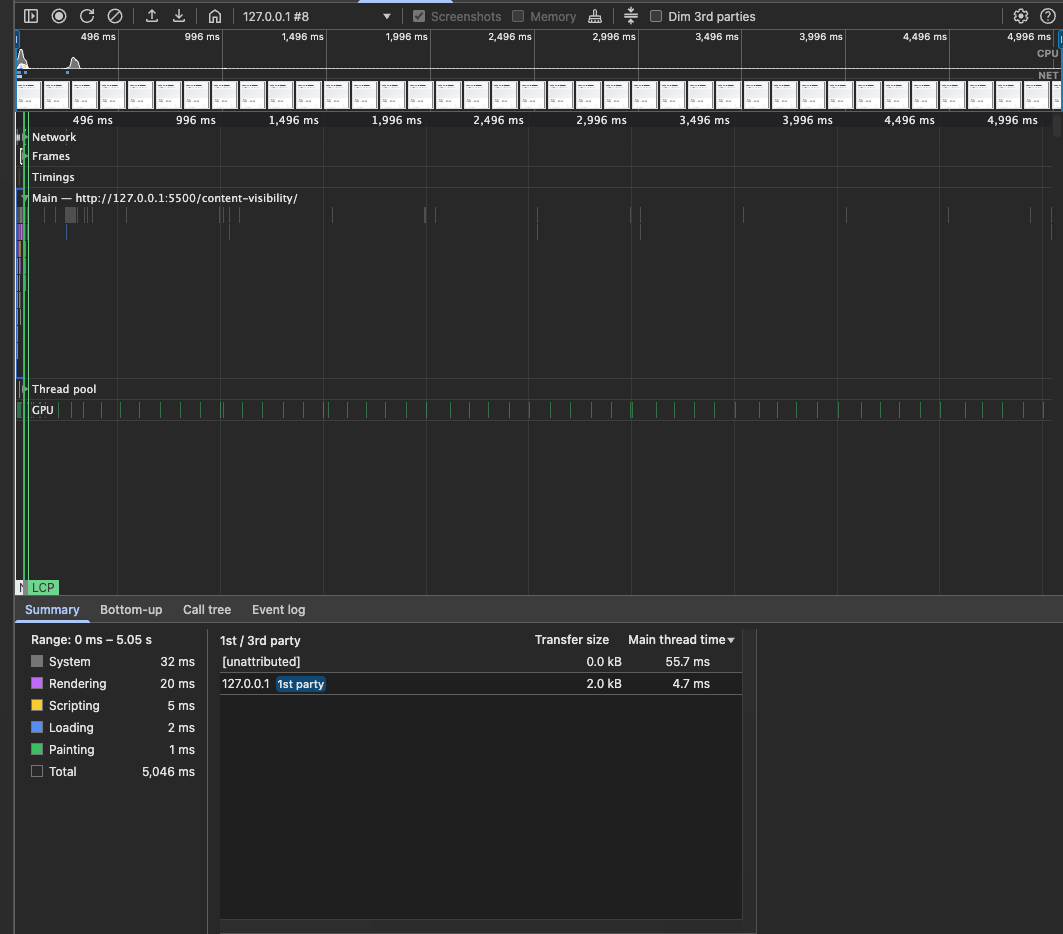
| Run | Rendering |
|---|---|
| 1 | 20 ms |
| 2 | 21 ms |
| 3 | 20 ms |
| Median | 20 ms |
Okay. That’s not subtle.
We went from:
42 ms → 20 ms

Or:

(42 - 20) / 42 × 100 ≈ 52%
In this experiment, adding content-visibility: auto was associated with roughly a 52% reduction in the Rendering activity reported by Chrome DevTools.
But we need to be careful with that number.
This doesn’t mean content-visibility makes websites 52% faster. It doesn’t even mean the entire page loaded 52% faster.
We measured one category of activity inside Chrome DevTools using one deliberately content-heavy page in one test environment.
The result will depend on things like:
- how much below-the-fold content you have
- how expensive that content is to render
- the browser
- the device
- the viewport
- the structure of the page
Our experiment was basically designed to give content-visibility a lot of work to skip.
So the useful conclusion isn’t:
“
content-visibilitymakes websites 52% faster.”
It’s this:
On pages with substantial off-screen content, allowing the browser to skip unnecessary rendering work can produce a measurable improvement.
web.dev has demonstrated the same idea with its own content-heavy demo and reported a large improvement there as well. But their number belongs to their test. Our number belongs to ours. Neither is a percentage you should copy into your own application without measuring it.
But our experiment isn’t finished yet. Because after scrolling, another problem appeared.